When you buy shares in a company, it’s worth keeping in mind the possibility that it could fail, and you could lose your money. But on the bright side, you can make far more than 100% on a really good stock. For instance, the price of Nestlé India Limited (NSE:NESTLEIND) stock is up an impressive 116% over the last five years. Unfortunately, though, the stock has dropped 3.1% over a week. However, this might be related to the overall market decline of 2.4% in a week.
While the stock has fallen 3.1% this week, it’s worth focusing on the longer term and seeing if the stocks historical returns have been driven by the underlying fundamentals.
Check out our latest analysis for Nestlé India
While the efficient markets hypothesis continues to be taught by some, it has been proven that markets are over-reactive dynamic systems, and investors are not always rational. One flawed but reasonable way to assess how sentiment around a company has changed is to compare the earnings per share (EPS) with the share price.
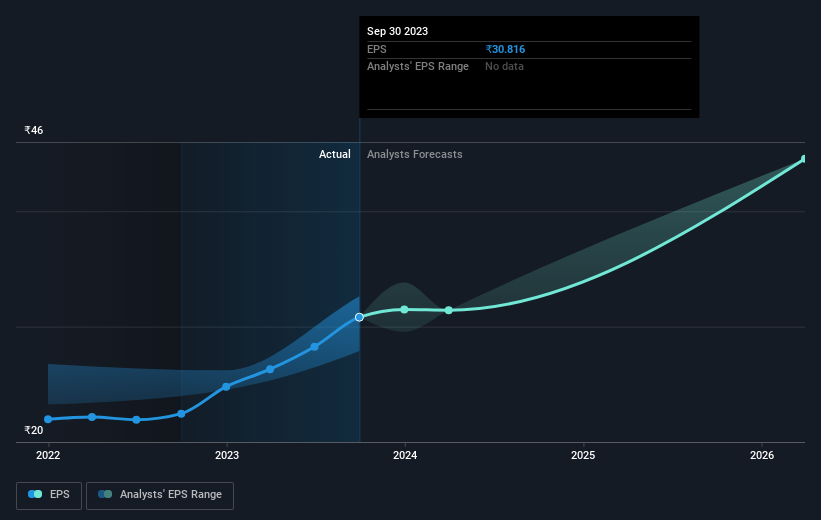
Over half a decade, Nestlé India managed to grow its earnings per share at 14% a year. This EPS growth is reasonably close to the 17% average annual increase in the share price. This indicates that investor sentiment towards the company has not changed a great deal. Indeed, it would appear the share price is reacting to the EPS.
The company’s earnings per share (over time) is depicted in the image below (click to see the exact numbers).

We know that Nestlé India has improved its bottom line lately, but is it going to grow revenue? Check if analysts think Nestlé India will grow revenue in the future.
What About Dividends?
It is important to consider the total shareholder return, as well as the share price return, for any given stock. Whereas the share price return only reflects the change in the share price, the TSR includes the value of dividends (assuming they were reinvested) and the benefit of any discounted capital raising or spin-off. It’s fair to say that the TSR gives a more complete picture for stocks that pay a dividend. We note that for Nestlé India the TSR over the last 5 years was 132%, which is better than the share price return mentioned above. And there’s no prize for guessing that the dividend payments largely explain the divergence!
A Different Perspective
Nestlé India’s TSR for the year was broadly in line with the market average, at 29%. That gain looks pretty satisfying, and it is even better than the five-year TSR of 18% per year. It is possible that management foresight will bring growth well into the future, even if the share price slows down. It’s always interesting to track share price performance over the longer term. But to understand Nestlé India better, we need to consider many other factors. Even so, be aware that Nestlé India is showing 1 warning sign in our investment analysis , you should know about…
But note: Nestlé India may not be the best stock to buy. So take a peek at this free list of interesting companies with past earnings growth (and further growth forecast).
Please note, the market returns quoted in this article reflect the market weighted average returns of stocks that currently trade on Indian exchanges.


