


Importance of milk and smallholder dairy farmers in India
India is the largest producer of milk in the world. According to the Department of Animal Husbandry and Dairying (2020), the monetary value of milk produced far exceeds the combined worth of rice and wheat (the most important crops in the country). However, the importance of milk in the Indian economy stems not just from its monetary value. India has a large vegetarian population for whom milk is the only source of animal protein. So, if milk production is affected by rising global temperatures, it is likely to have implications for nutrition and health.
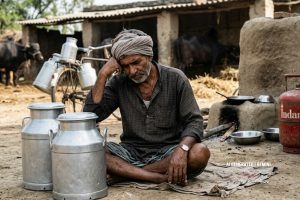
In addition, due to the nature of Indian agriculture, the impact on small farmers with limited resources is an important issue. For many such small farmers livestock rearing is the ticket out of poverty. With rising demand for milk among the economically upwardly-mobile Indian middle class, selling milk can become a reliable source of extra income for poorer households. Livestock is also used by farming households to tide over negative income shocks, as the sale of livestock is always a source of ready cash.
Data sources
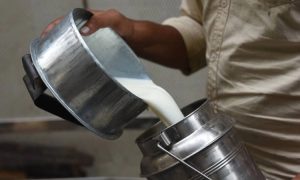
I use the Farmer’s Situation Assessment Survey of the National Sample Survey’s (NSS) 77th round (2018-19) to generate the main variable of interest, which is milk yield. This survey is a comprehensive evaluation of farming households from across the country. It provides detailed information about the composition of the herd maintained by households, including the number of animals in milk at the time of survey. In addition, the survey also provides the quantity of milk produced by each household in the last 30 days. Using this information, I construct a measure of milk yield per animal in milk per day, separately for cattle (cows) and buffaloes.
I combine the NSS data with weather variables – maximum temperature, minimum temperature, and rainfall for each day, sourced from the Indian Meteorological Department, and aggregated to the district level from 1° grid squares1. The constructed temperature variables correspond to the average in the recall periods of the NSS survey, which is a period of 30 days prior to the date of survey. I then merge the data with the NSS survey by district of the household and date of survey. The temperature data also allow me to estimate the number of hours that a district is exposed to different temperature ranges in the NSS survey recall period.
Empirical methodology
The study employs regression analysis to assess the relationship between milk yield and temperature. I run separate regressions for cattle and buffaloes to account for physiological differences in heat resistance. Buffaloes are in general more resistant to heat than cattle. Each regression controls for seasonality through ‘month fixed effects’, and regional factors through ‘district fixed effects’.2 I also include measures of household wealth and resources to partial out idiosyncratic ability of different households to mitigate the effect of heat on their animals.
I do separate regressions for minimum and maximum temperature. The literature predicts a bigger impact for rise in minimum temperature as maximum temperature is generally above the comfort zone for these animals. If the minimum temperature is low the animals get some respite during that time. If, on the other hand, the minimum temperature exceeds the comfort zone of the animal, then the impact on its physiology is severe.
It is well-established in the literature that the effect of high temperatures on yields is ‘non-linear’, that is, the impact gets accelerated above some threshold level of temperature. This implies that simple linear estimates may be understating the impact by averaging it over the entire temperature range. So, this study uses a second approach, which acknowledges that temperature may have non-linear impact on milk yield. Here, measures of hours exposed to different temperature intervals are used as explanatory variables in regression. The entire range of temperature is divided into four intervals that start from below 15°C and rises by 10° increments till the final interval of above 35°C. This allows the estimated impact of rise in temperature to differ by size of change as well as the level at which the change occurs.3
Findings
I find significant negative impact of higher maximum or minimum temperatures on milk yield of both cattle and buffaloes (Figure 1). A 1°C increase in average maximum temperature results in 2.4% fall in cattle milk yield, and 2.1% fall in buffalo milk yield. The corresponding figures for rise in minimum temperatures are 3.6% and 2.5% for cattle and buffaloes, respectively.
Figure 1. Impact of average temperature in the last 30 days on milk yield
 Notes: (i) The mid-point of the line segments represents the percentage change in milk yield for every 1°C rise in temperatures. (ii) The vertical line segments in the figure shows 95% confidence intervals. A 95% confidence interval means that, if you were to repeat the experiment over and over with new samples, 95% of the time the calculated confidence interval would contain the true effect.
![]()
The non-linear analysis results are shown in Figure 2. For both cattle and buffaloes, shifting an extra hour of exposure to higher temperature ranges leads to a bigger negative effect on milk yield. The highest impact is for the range above 35°C.
Figure 2. Change in milk yield with an hour increase in exposure, by temperature interval, in the last 30 days
 Notes: (i) The mid-points of each line segment represent the percentage change in milk yield as an hour of exposure increases in a particular temperature interval compared to a similar hour exposed to the temperature range less than 15°C, in the last 30 days. ii) The length of the line segments represents 95% confidence intervals.
![]()
Implications in the face of global warming
These findings have critical implications for smallholder dairy farmers as climate change progresses. A hypothetical scenario of a uniform 1°C temperature increase across all districts predicts significant declines in milk yields of more than half a litre (from 2.64 to 1.84 litres for cattle, and from 3.2 to 2.6 litres for buffaloes) per day per animal. This translates to income losses of Rs. 740 for cattle owners and Rs. 900 for buffalo owners, amounting to 8% of the average household’s monthly consumption expenditure. In terms of nutrition, the same loss implies daily protein intake decreases by 4.73 grams and 5.76 grams per capita for cattle- and buffalo-owning households, respectively. Nationally, a 1°C rise in temperature could reduce total milk production by 16.2 million tonnes, which is about 8.6% of the total milk production in 2018-19. Most of this decline is driven by longer exposure to higher temperatures. I calculate that the negative effect of an extra hour above 35oC for an average farmer will more than double as we compare scenarios with 1, 2, or 3oC rise in temperatures to the current situation.
Conclusion
This study underscores the substantial economic and nutritional challenges smallholder dairy farmers in India will face due to rising temperatures. The effects extend beyond individual households, posing risks to national milk production and food security. While larger producers may step in to meet demand, the losses sustained by small farmers – who are among the most vulnerable in society – are unlikely to be mitigated.
Notes:
- A 1° grid square is a unit of measurement of the Earth’s surface into rectangles. Each ‘square’ is in fact a rectangle of 1° of latitude by 2° of longitude.
- When studying data across regions, time, or groups, unobserved characteristics – like cultural or geographic differences – can bias results. Fixed effects account for these unchanging characteristics by effectively subtracting them out, allowing researchers to focus on the relationship between variables of interest.
- This approach of capturing non-linear relationships has been used by researchers extensively in the study of the effects of temperature on health and physiology of living organisms (see Schlenker et al. 2009, Blom et al. 2022, Somanathan et al. 2021).
Further Reading
- Blom, Sylvia, Ariel Ortiz-Bobea and John Hoddinott (2022), “Heat exposure and child nutrition: Evidence from West Africa”, Journal of Environmental Economics and Management, 115: 102698.
- Das Gupta, A (2024), ‘Influence of High Temperatures on Milk Yields for Small-Holder Dairy Farmers in India’, Working Paper. Available at SSRN.
- Hemme, T and J Otte (2010), Status and Prospects for Smallholder Milk Production: A Global Perspective, Food and Agriculture Organization of the United Nations.
- Herrero, M, et al. (2013), “The roles of livestock in developing countries”, Animal, 7(s1): 3-18.
- Schlenker, Wolfram and David B Lobell (2010), “Robust negative impacts of climate change on African agriculture”, Environmental Research Letters, 5(1): 014010.
- Schlenker, Wolfram and Michael J Roberts (2009), “Nonlinear temperature effects indicate severe damages to US crop yields under climate change”, Proceedings of the National Academy of Sciences, 106(37): 15594-15598.
- Somanathan, E, Rohini Somanathan, Anant Sudarshan and Meenu Tewari (2021), “The Impact of Temperature on Productivity and Labor Supply: Evidence from Indian Manufacturing”, Journal of Political Economy, 129(6): 1797-1827.
- Thornton, PK, J van de Steeg, A Notenbaert and M Herrero (2009), “The impacts of climate change on livestock and livestock systems in developing countries: A review of what we know and what we need to know”, Agricultural Systems, 101(3): 113-127.
You can now read the most important #news on #eDairyNews #Whatsapp channels!!!
🇮🇳 eDairy News ÍNDIA: https://whatsapp.com/channel/0029VaPidCcGpLHImBQk6x1F